Analysis of
Governance Principles of BRSR Data
Authors:
Aditya Kulkarni
Lakshmi Murthy
Anuradha Damle
Raghavachari Madhavan
With a rapidly evolving business landscape, the importance of analysing companies based on Environmental, Social, and Governance (ESG) criteria has never been more pronounced. The Business Responsibility and Sustainability Report (BRSR) has become an essential framework for analysing the environmental, social, and governance (ESG) performance of companies. Mandated by regulatory bodies like the Securities and Exchange Board of India (SEBI), BRSR provides a standardized approach for Indian companies to disclose their sustainability practices, making it easier to evaluate and compare their commitment to responsible business operations. In this report we present an analysis of BRSR data filed by companies in FY 2022-23.
Executive Summary
This analysis of BRSR data focuses on Governance. While data on two principles (P1: Ethics, Transparency, and Accountability and P4: Stakeholder Engagement) are relevant for an understanding of Governance, this analysis focuses on quantitative information for P1.
Key findings include:
- Varied Awareness: Training Variety Score for employees and workers is significantly lower than for Key Management Personnel and Board of Directors.
- Data Quality Issues: Inconsistent and potentially inaccurate reporting of conflicts of interest, disciplinary actions, and fines.
- Market Cap impact: When companies are segmented by market capitalization level, each segment exhibits a similar distribution of varied governance practices.
The potential reasons for varied levels of Governance include level of resources dedicated for related programs, structure (or lack thereof) of implementation process, visibility, buy-in and prioritization from senior leadership and perceived value, importance and relevance of the programs.
Our recommendations from this analysis are:
- Employee and Worker Training: Ensure appropriate Training Variety Score and coverage by designing and conducting awareness programs that reach all relevant audiences.
- Internal process of program implementation: Analyze the factors in “hypotheses of potential reasons” impacting the Governance level to identify and implement required changes to the process of implementing awareness programs.
- Data Accuracy and Transparency: Review internal data controls, and strengthen as required to ensure accurate and consistent reporting of all relevant data.
- Best Practices across companies: Support knowledge sharing among companies to foster best practices in ESG reporting and governance.
Background & Focus Area
The Business Responsibility and Sustainability report (BRSR) framework mandates annual disclosure filing by registered Indian companies to be compliant with the regulatory body SEBI. We use filing data from fiscal years 2022-23 as the basis for this analysis. Please refer to our earlier blog on a detailed review of everything about data: State of Sustainability Disclosures by Indian Companies – Altometa Consulting
Our focus in this report is to perform an analysis for evaluating the state of Sustainability (specifically Governance) related disclosure, and classifying companies based on their Governance levels. Organizations can be better informed about their relative standing with respect to compliance, and interested parties (such as Investors) can make informed decisions based on Governance performance of companies.
In this analysis we take the following approach:
· Map the BRSR principles into Sustainability (ESG) components for analysis
· Define factors for analysis of Governance related principles
· Analyse the factors and derive insights
· Summarize the overall impact and ways to improve Governance metrics of companies
Mapping BRSR principles into Sustainability components
We categorize the 9 Principles of BRSR, P1 to P9 into the Sustainability components of Environment, Social and Governance as shown in the table below:
Environment |
P2 – Product Lifecycle Sustainability |
P4 – Stakeholder Engagement |
P6 – Environmental Management |
P9 – Consumer Protection-(9.2) |
Social |
P3 – Employee Well-being |
P4 – Stakeholder Engagement |
P5 – Human Rights |
P7 – Public Policy Advocacy |
P8 – Inclusive Growth and Equitable Development |
P9 – Consumer Protection |
Governance |
P1 – Ethics, Transparency, and Accountability |
P4 – Stakeholder Engagement |
Of the two principles P1 and P4 related to our focus area of Governance, P1 related disclosures have several numeric quantitative data; however, P4 related disclosures are qualitative and non-numeric. For the purposes of this analysis, we will focus on the numeric disclosures, and hence do not include P4 related data for our analysis. In a future report, we will provide qualitative assessment of the P4 disclosures.
Governance Factors in P1 Disclosures (Ethics, Transparency, and Accountability)
There are four P1-related numeric disclosure data elements in the BRSR filings: 1) Training and Awareness programs, 2) Conflicts of Interest, 3) Disciplinary Actions, and 4) Fines.
1) Training and Awareness
BRSR filings contain data related to training and awareness programs that the company conducts. The goal of these programs is to ensure that people involved in company operations are completely aware of, and fully competent to conduct themselves in compliance with the company’s governance policies and procedures.
We identify two aspects of awareness: a) The training variety score (average number of training types per member) and b) The prevalence of awareness within the company (percentage of members in the organization that are covered by trainings). While the prevalence of awareness is necessary for effective governance, we expect that high training variety score would encourage better skills and adherence to policies and procedures.
Data on these aspects is available for specific categories of the targeted audience for training: Board of Directors (BOD), Key Management Personnel (KMP), Employees (EMP), Workers (WRK). To enable comparison of performance across companies, we normalize the reported training numbers by the size of each of these constituencies within the company and then aggregate them.
These two ratios are created as aggregations:
Training Variety Score
Training Variety Score refers to the number of training session types offered per person in the target audience. Higher Training Variety Score values are desirable, as higher variety indicates a better chance that the company’s workforce is offered role-relevant training. We will provide an analysis of the Training Variety Score for each workforce segment.
Percent Coverage (of Awareness) –Awareness Coverage
Since availability of training variety is not sufficient to characterize the participation levels, we also define Percent Coverage as the proportion of
individuals reached by the training program, expressed as a percentage. We will provide an analysis of Percent Coverage for each workforce segment.
2) Conflicts of Interest
BRSR disclosures for each company includes the size of the Board of Directors and Key Management Personnel, as well the number of reported conflicts of interest for each of these constituents.
Conflict-of-Interest Ratio
We define this as the ratio of the total number of conflicts of interest disclosed normalised by the total size of the two related constituents (BOD and KMP). Lower values of this ratio indicate that the company is operating without significant conflicts.
3) Disciplinary Actions
BRSR disclosures for each company includes the number of reported Disciplinary Actions for each of the four constituent groups – BOD, KMP, EMP and WRK.
Disciplinary Action Ratio
We define this as the ratio of the total number of disciplinary actions disclosed normalised by the total size of the four constituents. Lower values of this ratio indicate that the company is operating with significant adherence to governance policies and principles.
4) Fines
BRSR discloses for each company the monetary value of reported Fines assessed on the company by regulators.
Fine Ratio
We define this as the ratio of the total Fines levied on the company normalised by the total revenue reported for the Fiscal Year. Lower values of this ratio indicate that the company is operating with significant adherence to regulations.
Analysis & Insights
Training Variety Score
The charts below show Training Variety Score distribution across companies within segments BOD and KMP, with the Training Variety Score bucketed into bands of 10%.
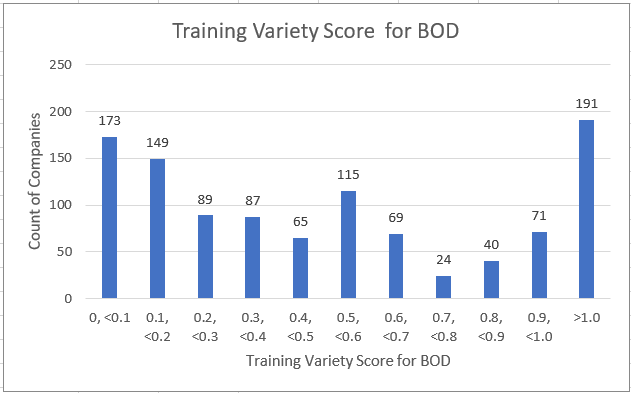
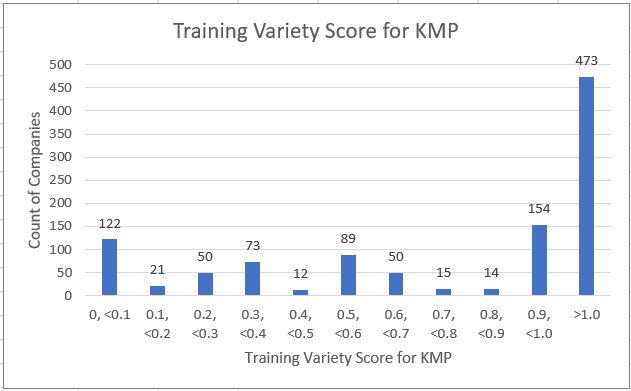
Observations:
· Around 24% (262) of all companies have Training Variety Score above 90% for Board of Directors (BODs).
· Training Variety Score is high in the Key Management Personnels (KMP) segment. Around 58% (627) of all companies have Training Variety Score above 90% for KMPs. Training Variety Score higher than 100% might indicate that key people driving strategies in these companies are trained on multiple occasions / policies.
· Further granular disclosures on program level information may be required to get a clearer understanding of intensity.
We now look at the charts below for the distribution of Training Variety Score for workforce segments EMP and WRK.
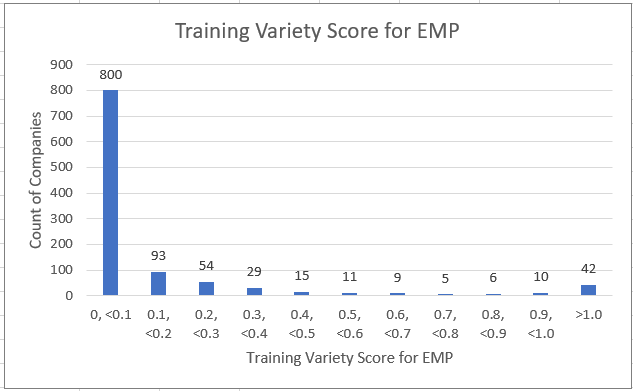
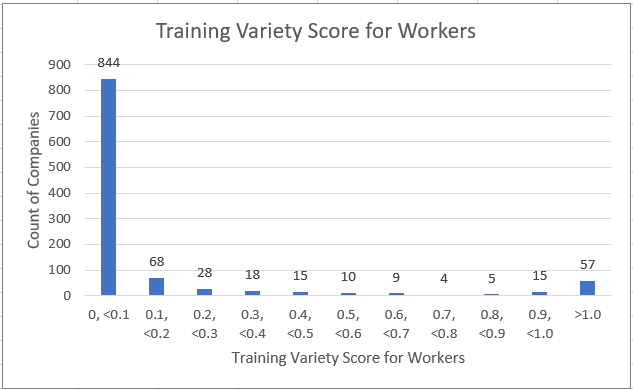
Observations:
· Around 75% of all companies have Training Variety Score for Employees (800) and Workers (844) at below 10%.
· Around 5% (52) of all companies have Training Variety Score above 90% for Employees.
· Around 7% (72) of all companies have Training Variety Score above 90% for Workers.
· These numbers indicate that Training Variety Score for Employees and Workers is lower than that for KMP or BOD segments.
· Companies may need to focus on identifying training areas and delivering it to Employees and Workers.
Examples of Higher training variety– DIVI’S LABORATORIES LIMITED, Blue Star Limited
Examples of lower training variety — Axis Bank Limited, ROSSELL INDIA LIMITED
Awareness Coverage
We show in the charts below the Awareness Coverage distribution across companies within each of their workforce segments BOD and KMP, with the Awareness Coverage bucketed into bands of 10%.
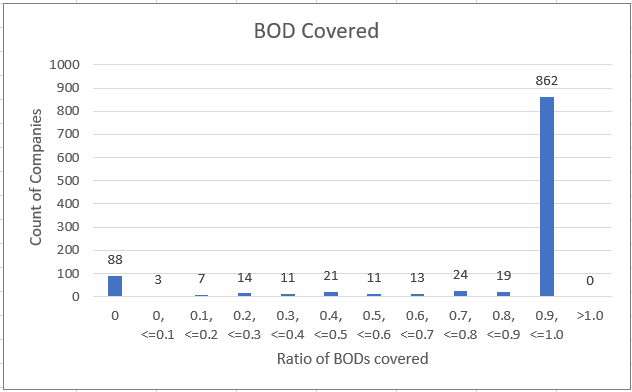
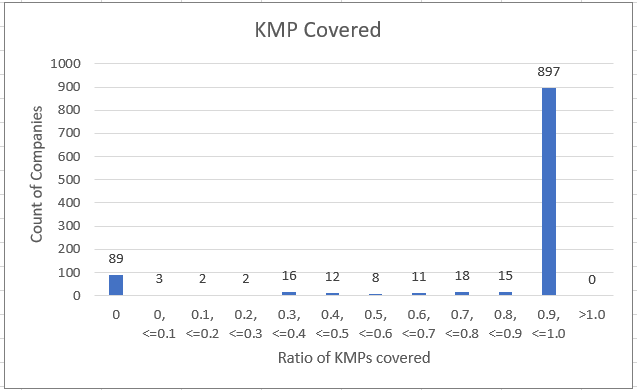
Observations:
· In both BOD and KMP segments most companies have high percentage (over 90%) of persons covered by awareness programs.
· However nearly 10% of companies report 0% Awareness Coverage for both BOD (88) and KMP (89) segments, which may be due to reporting issues.
We now look at the charts below for the Awareness Coverage for workforce segments EMP and WRK.
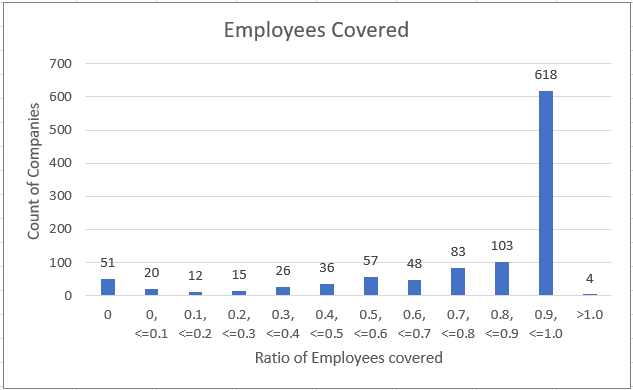
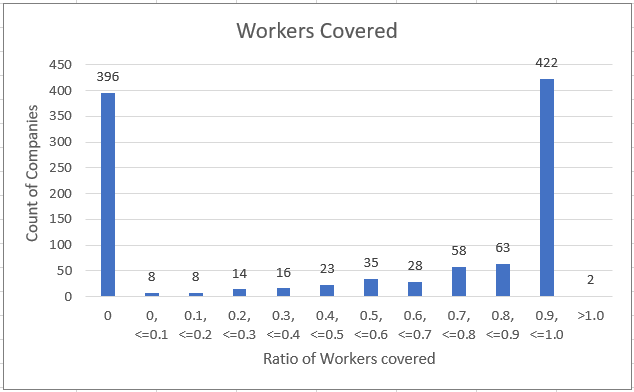
Observations:
· For Employee category, around 57% (618) of all companies provide high Awareness coverage (over 90%).
· For Worker category, only 39% (422) of all companies provide high Awareness coverage (over 90%).
· For Worker category, around 37% (396) of all companies have 0 persons covered by awareness programs. This high percentage of non-coverage
may be related to a reporting issue – these companies may have no workforce within the Workers category.
· Persons covered greater than 100% occurs in few cases may be due to reporting issues like worker turnover, attrition or more trainings to employees.
Examples of High Awareness Coverage — WELSPUN ENTERPRISES LIMITED, Tata Consumer Products Limited
Example of Low Awareness Coverage — ICICI Securities Limited
Hypothesis of Reasons for low Awareness levels
Our hypotheses for the key reasons why companies may report low Awareness levels include:
· Program execution: Companies may lack a structured implementation process, or may have an over-reliance on executing the program as an episodic process (e.g. one-time event) instead of continuous learning. Further, inconsistent delivery across different departments or locations could also hinder the achievement of Governance goals.
· Leadership support: Senior leadership of companies may either not buy-in or prioritize awareness programs. Sometimes, even the appearance of not having adequate sponsorship might result in lack of focus on awareness programs.
· Employee engagement: Employees not perceiving the awareness programs as valuable or relevant to their job roles can cause low engagement. Further, if there is a high turnover rate that could result in delays in achieving and maintaining higher awareness.
· Resourcing: Training and awareness programs require skilled trainers, program managers and designers. Timely and adequate allocation of budget or resources to design and implement awareness programs will be necessary to achieve required levels of awareness.
Conflict-of-Interest ratio
The ratio is derived by the total number of conflicts of interest disclosed normalized by the total size of the two related constituents (BOD and KMP). Lower values of this ratio indicate that the company is operating without significant conflicts.
We show in the chart below the distribution of Conflict-of-Interest Ratio for all companies.
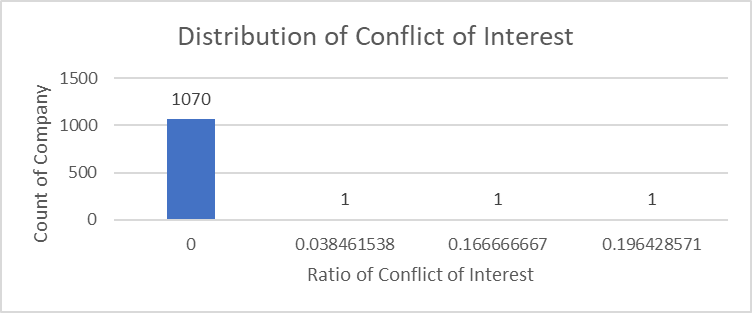
Out of 1073 companies, 1070 companies have 0 value for Conflict-of-Interest Ratio. i.e. no reported conflicts of interest by BOD or KMPs. This can be either because there are genuinely minimal conflicts in the operating environment, or it can be an artifact of differences in what companies choose to report.
Disciplinary Action ratio
The ratio is derived by the total number of disciplinary actions disclosed normalised by the total size of the four constituents. Lower values of this ratio indicate that the company is operating with significant adherence to governance policies and principles.
We show in the chart below the Disciplinary Action Ratio distribution of all companies.
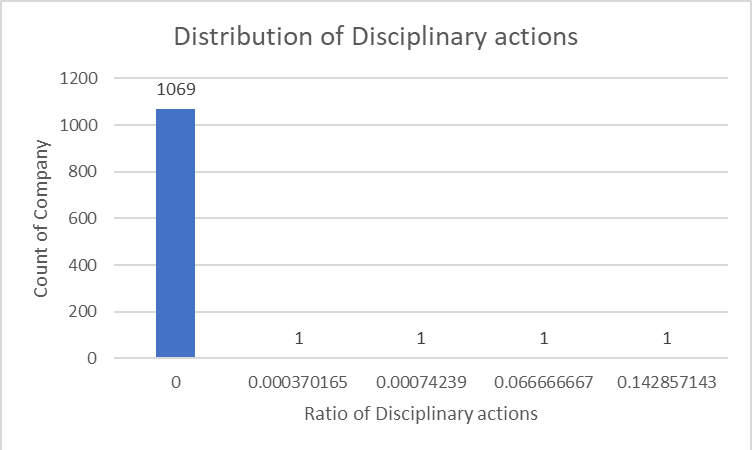
Similar to the Conflict-of-Interest Ratio, out of 1073 companies, 1069 companies have 0 Disciplinary Action ratio. i.e. no reported Disciplinary actions required against BOD or KMPs or Employees or Workers. As mentioned earlier, this can be either because there are genuinely no disciplinary measures taken in the operating environment, or it can be an artifact of differences in what companies choose to report.
Fine Ratio
The ratio is derived by the total Fines levied on the company normalized by the total revenue reported for the Fiscal Year. Lower values of this ratio indicate that the company is operating with significant adherence to regulations.
We show in the chart below the Fine Ratio distribution of all companies.
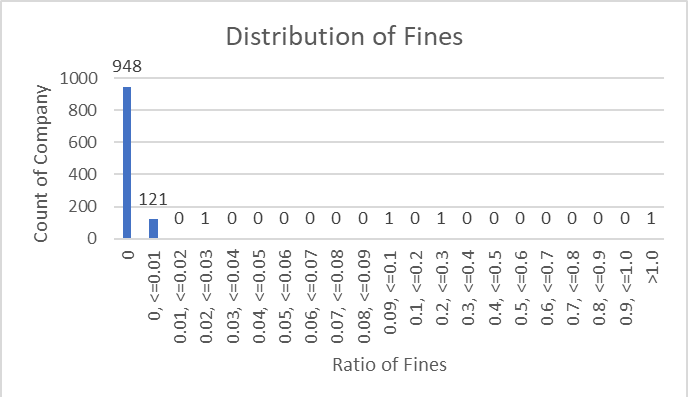
Observations:
· Out of 1073 companies, 88% have no fines, and a further 11% of companies have Fines below 1%
· 4 companies have Fines above 1% of their Revenue.
· A company having Fines ratio more than 100% might have reported data incorrectly (Bombay Dyeing & Mfg Company Limited)
Segmenting Companies into Governance Patterns
We used Pragya (see Pragya Overview for an introduction) to perform data analysis and develop clusters of companies based on the 4 Governance ratios presented above.
The 9 segments created by Pragya are shown in the following Cluster Blueprint. The chart shows the distribution of each of the 5 ratios as a row. Each column represents a population of companies – first the set of all 1073 companies (‘Overall’), and then the 9 segments created by Pragya, each as a cluster. Distributions are presented using Box-plots, with a centre line representing the average value of that row for that segment, the 75th and 25th percentile of values represented by the top and bottom of the rectangle, and the whiskers showing the tail of the distributions. Outliers are presented as diamonds.
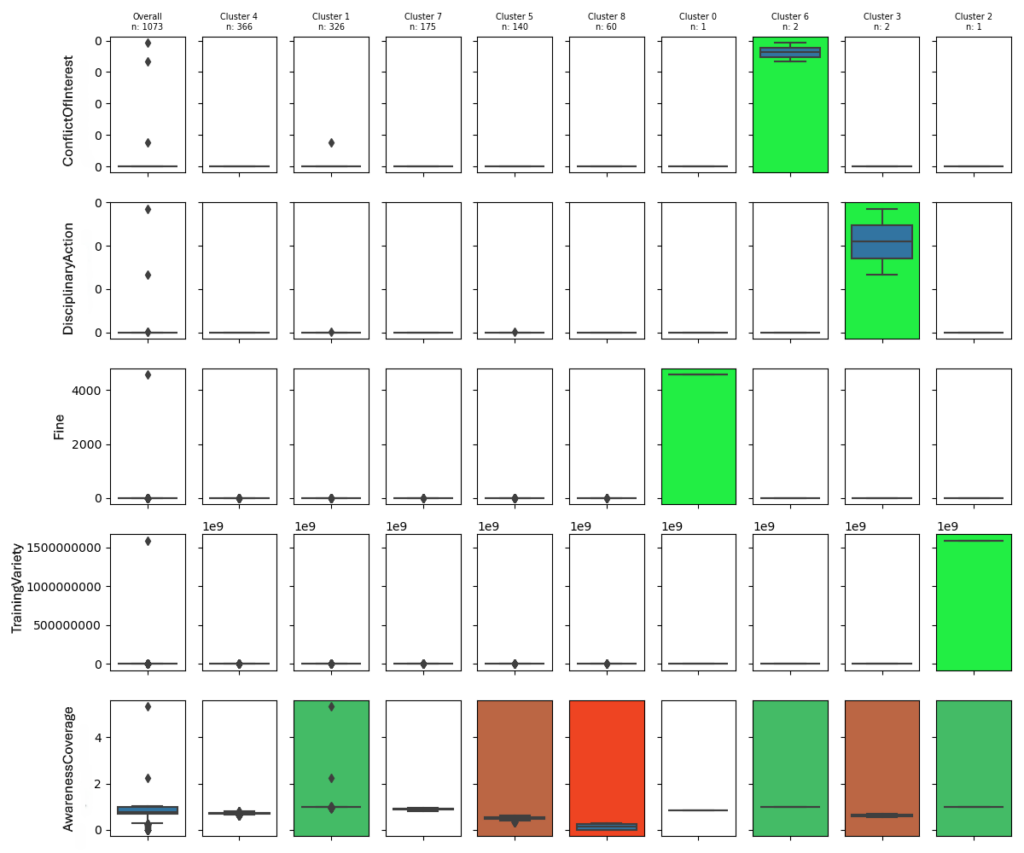
Observations:
Overall Distribution: The Box-plots in the first column, representing the distribution of all companies, shows that Awareness Coverage has a small range of values, whereas each of the other ratios has most of the values at 0 (no “box”), and a few outliers (the diamonds).
Average Segment: The largest segment, Cluster 4 with 366 companies (34%), represents the group of companies that have values in close proximity to the Overall average for each of the ratios. These companies are what we would call as performing at ‘average’.
The segment Cluster 7 with 175 companies (16%) also has values in close proximity to the Overall average for each of the ratios. The Awareness Coverage of Cluster 7 is 12 percentiles above the average overall Awareness Ratio, while that of Cluster 4 is just 5 percentiles below the average of overall. This makes Cluster 7 companies better over companies in Cluster 4.
Yet both the segments have room to improve Training Variety Score. Cluster 4 needs to improve Awareness Coverage ratio as well.
Best Segment: The segment, Cluster 1 with 326 companies (30%), represents the group of companies that on average have an Awareness Coverage that is around 75th percentile of overall Awareness Coverage, capturing all of the high values of Awareness Coverage, and average (near zero) values for the other four ratios. These companies have the Best Governance measures, perhaps except for the one company that seems to have a reported conflict of interest (the diamond) and 3 companies that reported Awareness coverage above 100% (may be due to reporting issues- shown as diamond). Also, these companies have room to improve Training Variety Score.
Poor Segment: Cluster 5, with 140 companies (13%) represents the group of companies that are showing an average Awareness Coverage that is about 28 percentile of below overall average Awareness Coverage, and average (near zero) values for the other four ratios. These companies have room to improve their Awareness Coverage and Training Variety Score.
Worst Segment: Cluster 8, with 60 companies (6%) represents the group of companies that have the worst showing an average Awareness Coverage that is about 65 percentiles below overall average Awareness Coverage, and captures all the companies with the lowest Awareness Coverage values. The only redeeming feature is that these companies have average (near zero) values for the other four ratios. These companies have significant room to improve their Awareness Coverage ratio measure. Also, these companies should improve Training Variety Score.
Outlier Segment: Clusters 0, 6, 3 and 2 clusters capture a total of 6 companies (0.5%), and represent outliers in each of the 4 ratios – Fines, Conflict-of-Interest, Disciplinary Actions and Training Variety Score respectively. Cluster 3 has Awareness coverage slightly below overall average Awareness coverage by 16 percentiles. Cluster 2 has a Training Variety score significantly higher than the overall ratio, suggesting a potential reporting issue. It is useful to look at these Companies as perhaps having either a rare, one-off event, and requiring monitoring.
Insights of clusters
· Given our previous analysis, it is not a surprise that four of the clusters focus in on outliers in Conflict-of-Interest (cluster 6), Disciplinary Actions (cluster 3), Fines (cluster 0) and Training Variety Score (Cluster 2). These clusters isolate the companies that have reported the respective high ratios.
· Cluster 1 demonstrate that positive ratio Awareness Coverage above overall average and other positive ratio Training Variety Score near overall average values. And the negative ratios (Conflict-of-Interest Ratio, Disciplinary Action Ratio and Fine Ratio) are close to overall average. This indicates that companies in the Cluster1 perform better from a Governance perspective.
· Clusters 5 and 8 have Awareness Coverage ratio below overall average, which has negative impact on the nature of the companies as seen for Governance.
Deep dive into Cluster 1
We present below a table showing company Sector distribution of companies within Cluster 1. In addition to presenting the representation of each sector in the overall population of companies, we present the corresponding representation within Cluster 1, and also the percent of companies in the sector that are within Cluster 1. The ratio of the proportion of companies within a Sector in Cluster 1 to the overall population represents the Over (> 100%)/Under (<100%) representation of the Sector within the cluster.
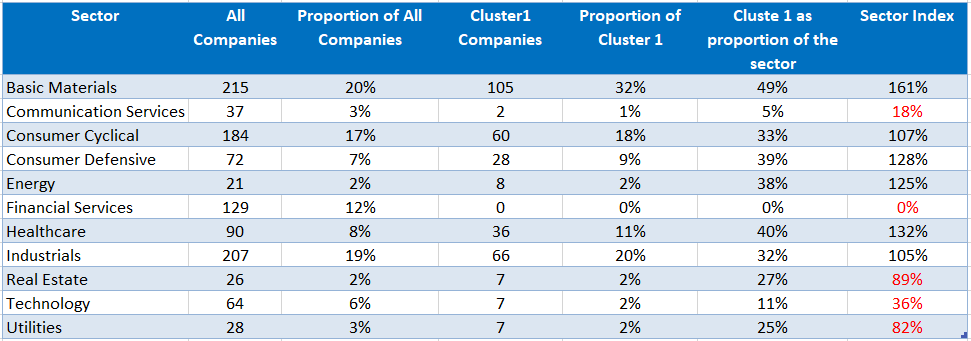
Observations:
· ‘Basic Materials’, ‘Industrials’ and ‘Consumer Cyclical’ sectors form 71% of Cluster 1 and are highest constituents of this Cluster.
· ‘Financial Services’ sector has least number of companies (0), i.e. a 0% contribution to
this Cluster.
Comparing the Sector distribution of companies within Cluster 1 to the overall distribution of companies, we see that Communication Services, Financial Services, Real Estate, Technology and Utilities sectors are under-represented in Cluster 1, while Basic Materials, Consumer Defensive, Energy and Healthcare are over-represented. Companies in the under-represented sectors need to do provide more focus on their Governance.
Conclusion
In this report we introduce novel analysis of the BRSR filings data, focusing on the Governance aspect of Sustainability practices. There have been few previously published analyses of BRSR filings data, and especially none that focus on the Governance pillar. We utilize a variety of analytical techniques, including those from our Data Science platform Pragya to provide novel segmentation of companies.
In our pioneering research, we have examined Governance related BRSR disclosures of companies, paying specific attention to the numeric data provided for the P1 principles. We found that while Awareness Coverage is distinguishing features across Companies, Disciplinary Actions, Conflict-of-Interest, Fines and Training Variety Score are less so (other than for outliers).
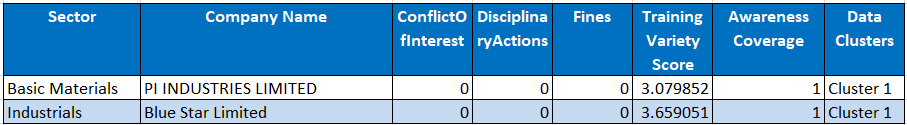
Examples of companies that score well with our Governance measures are – PI INDUSTRIES LIMITED, and Blue Star Limited
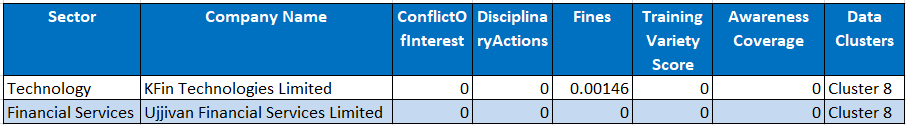
Examples of companies that don’t score well include – Ujjivan Financial Services Limited and KFin Technologies Limited.
Our overall recommendations for Indian businesses include:
a. Increasing Awareness for Employees and Workers will demonstrate a regime of better Governance practices through higher Awareness Coverage Ratio. This can be done by increasing Training Variety Score (Training per person) for Employees and Workers. Also, Awareness programs should be increased for Workers by companies.
b. Companies with lower degrees of Awareness Coverage should study the contributing factors, and correlated consequences. Based on such studies, companies can target appropriate responses for improvements.
c. Companies should add more transparency in reporting awareness programs, especially to create clarity for Intensity – for example repeated deployment of the same program vs different programs. To ensure that there is more accuracy of conflicts of interest, disciplinary actions, and fines, companies should assert any zero values are intentional.
In our next article, we will analyze the next categories of sustainability.